Total Cost Modeling: The Cheaper Vendor That Cost $4M More
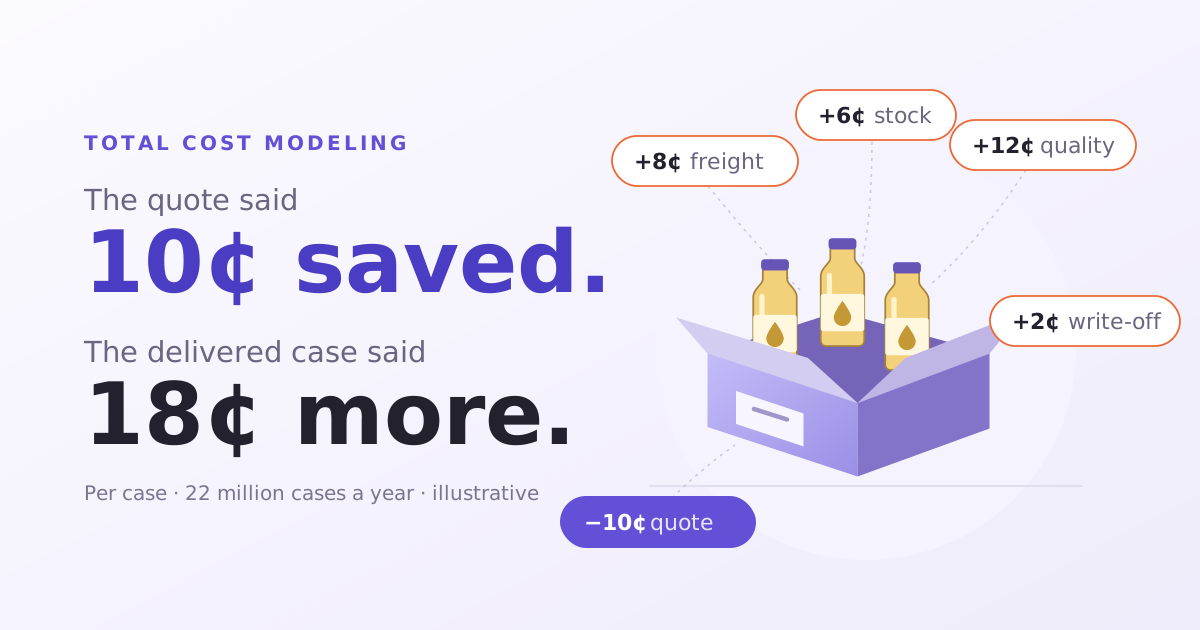
A 10¢ saving on the quote became an 18¢ loss on every case. How total cost modeling exposes the freight, inventory, storage, quality and obsolescence costs that vendor quotes never show.
Loading article...
Imagine a buyer at a national cooking-oil brand who saves the company $2.2 million on packaging. Six months later, the same decision has left the company nearly $4 million worse off. Nobody made a mistake and every report is correct, yet nobody can say where the money went.
It starts with an ordinary annual packaging tender. The brand buys plastic bottles, caps and cardboard boxes, packs 12 bottles to a case, and ships about 22 million cases a year from its plant near Dallas, Texas. Two vendors make the final round:
Vendor A is in Fort Worth, about 40 miles from the plant. It delivers weekly, and its bottles run cleanly on the filling line. Its quote is $2.00 per case.
Vendor B is in Birmingham, Alabama, about 600 miles away, and quotes the same specification at $1.90 per case.
The comparison sheet shows one difference: price. At 10¢ less per case across 22 million cases, Vendor B looks like $2.2 million a year in savings, so the buyer awards it the contract.
What just happened is not only a change in price, but a change in the entire supply chain behind it: where the bottles ship from, how often they arrive, how much stock the plant must hold, how they behave on the line, and how they fail in the market. None of that appears on the quote.
The case is hypothetical and the numbers are illustrative, but the pattern is real. So let's follow the money: where the hidden costs sit, why nobody sees them, and how total cost modeling puts them into the comparison before the contract is signed.
The quote shows the saving. The delivered case shows the cost.
What the quote sheet leaves out
Put the two vendors side by side again, but this time include every cost that changes depending on which vendor you choose.
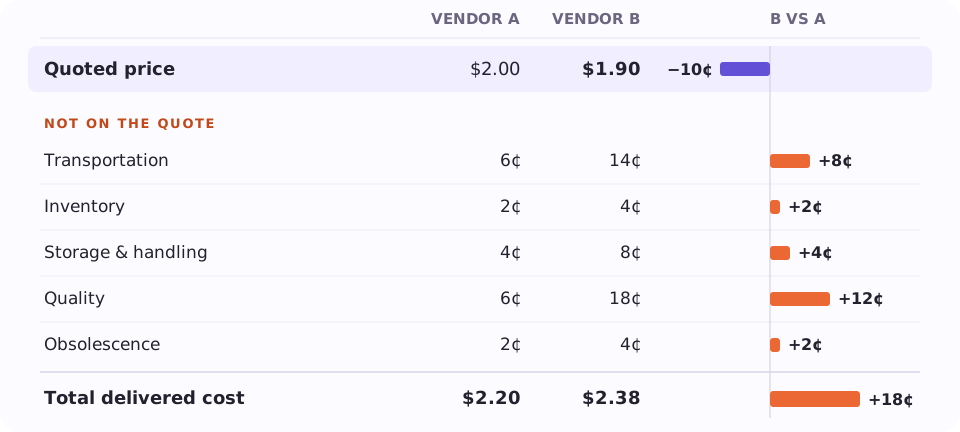
Illustrative. On the quote, Vendor B saves 10¢ per case. On total delivered cost, it costs 18¢ more.
Here is what the full comparison shows:
On the quote, Vendor B is 10¢ per case cheaper.
On total delivered cost, Vendor B is 18¢ per case more expensive: $2.38 against $2.20.
The hidden costs add 28¢ per case, almost 15% on top of Vendor B's $1.90 quoted price.
Across 22 million cases, the savings tracker reports $2.2 million saved, while the business actually spends nearly $4 million more (18¢ × 22 million = $3.96 million).
Why buyers compare only price
The comparison sheet stops at price because that is practical, not careless. A study of supplier selection at Nissan's Smyrna plant (Queiros, MIT, 2021) found:
A new vehicle program requires sourcing more than 2,000 parts, so buyers are under constant pressure to simplify.
As a result, “supplier selection is often performed with an excessive focus on part cost only. This is particularly true for smaller or less expensive parts, where logistics and other costs are perceived to be small.”
Buyers' performance targets covered part, packaging, tooling and tariff costs only, and nothing downstream.
Packaging is exactly the kind of “small, inexpensive” category the study describes.
The five hidden costs
Each of these costs is created by the vendor choice, but none of them appears on the quote.
Transportation: +8¢ per case
The quote is ex-works, so the brand pays to bring the packaging in.
Vendor B is 600 miles away instead of 40.
Empty bottles are mostly air, so a truck fills up on volume long before it reaches its weight limit. The result is more truckloads, each one longer.
Watch the delivery terms. A “delivered” price includes this cost in the quote. An ex-works price leaves it for the logistics budget to discover.
Inventory: +2¢ per case
Safety stock depends on how long supply takes to arrive and how much that lead time varies.
A 600-mile lane is both longer and less predictable than a 40-mile one, so the plant holds about three weeks of bottles instead of one, and that ties up cash.
In the Nissan study, remote-sourced parts needed 8 to 10 times more inventory than nearby ones.
Storage and handling: +4¢ per case
The extra stock doesn't fit at the plant, so it goes to a rented overflow warehouse.
That adds a shuttle truck and extra forklift moves to bring stock back to the line.
In the Nissan data, warehouse storage cost about 4 times as much per cubic meter as storage at the plant dock.
Quality: +12¢ per case
This is the largest hidden cost, and it has nothing to do with distance. It comes from Vendor B's bottle specification:
On the line: the neck finish varies slightly more, so the capper rejects more bottles and the filling line slows down.
In the market: the bottles are lighter, so more of them leak in summer heat and stacked distributor warehouses. That brings damage claims and replacement stock.
The pattern from the study: the cost of fixing one defect is similar whichever vendor caused it. What differs is how often defects happen. For windshields, the worst supplier's warranty claim rate was 5.6 times the best supplier's.
Obsolescence: +2¢ per case
Labels and artwork change often, for promotions, new pack claims or regulatory updates.
When they do, every printed bottle and case in the pipeline is at risk of being written off.
A longer, deeper pipeline strands more stock. In the Nissan data, the regions with the longest lead times had up to 4 times the average obsolescence.
Total: 8¢ + 2¢ + 4¢ + 12¢ + 2¢ = 28¢ per case, set against a 10¢ saving.
Two root causes: distance and quality
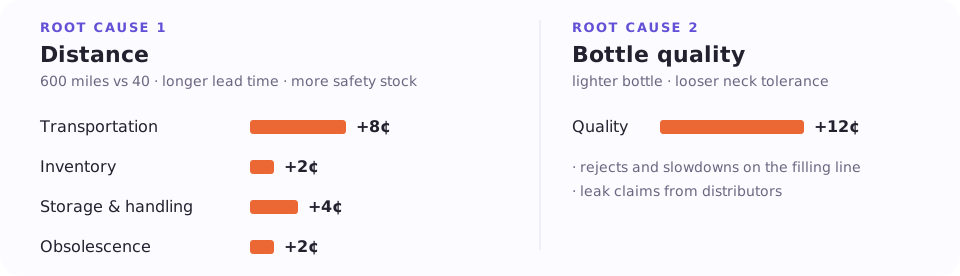
The five hidden costs trace back to two facts about Vendor B that the quote sheet does not price.
Two vendor attributes, distance and bottle quality, drive all five hidden costs.
Distance sets off a chain reaction:
Longer distance → longer, less predictable lead time
Longer lead time → more safety stock
More stock → more cash tied up, more warehouse space, and more stock exposed to artwork changes
Quality comes from the bottle itself: a lighter bottle and a looser neck tolerance mean more rejects and more leaks.
The two causes make each other worse. When a leak problem appears, a 600-mile pipeline means weeks of suspect bottles are already on the way, and the line has to keep using them. The Nissan study calls this the compounding effect: for remote suppliers, transportation, storage, inventory, obsolescence and pipeline quality costs rise together.
When the hidden costs decide the outcome
The study also offers an important counterweight:
For about 90% of the parts it analyzed, non-price costs made up less than 15% of total delivered cost.
So price usually dominates. If a distant vendor is 25% cheaper, it will probably still win.
A 10¢ saving on a $2.00 quote is 5%. That is a close call, and close calls are where the hidden costs decide the outcome.
Who sees each cost, and when
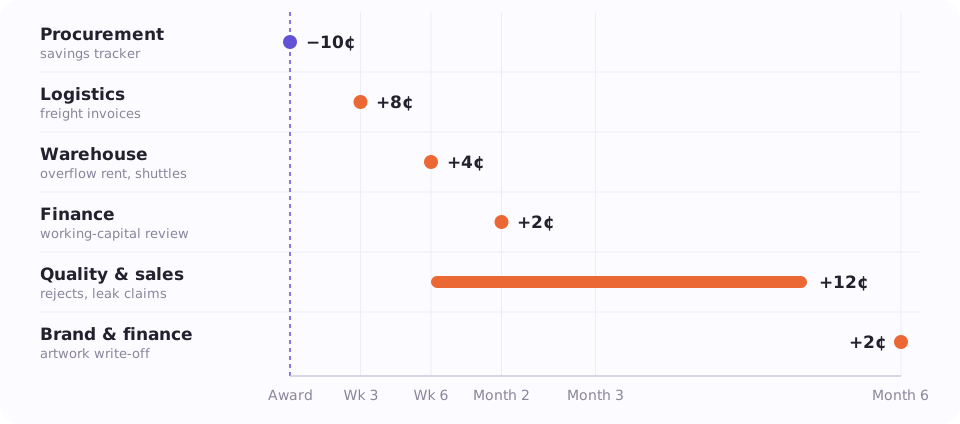
The hidden costs stay hidden for a second reason: each one lands in a different team's budget, at a different time.
The saving is booked on day one. The costs arrive over six months, in other teams' budgets.
Week 0: procurement books the saving.
Week 3: freight invoices start arriving in logistics.
Week 6: the warehouse pays overflow rent, and line rejects begin.
Month 2: finance sees more cash tied up in inventory.
Months 3–5: leak claims arrive from distributors.
Month 6: the next artwork change strands printed stock.
Each cost appears in a real invoice, report or claims register. What's missing is the link back to the decision that caused it, and building that link is the job of a total cost model.
What is a total cost model?
A total cost model calculates what a purchase really costs the business: the supplier's price plus every cost the business takes on to turn that purchase into usable product. Total cost modeling links those costs to the decisions that cause them. For a sourcing decision, the result is often called total delivered cost. It is closely related to total cost of ownership (TCO), which applies the same idea across an asset's whole life, from purchase to disposal.
For a vendor decision, it works as a simple equation:
Total delivered cost = price + transportation + inventory + storage & handling + quality + obsolescence (+ tooling and tariffs, where they apply)
Each term is driven by something you can observe about a vendor before signing:
Distance and delivery terms → transportation
Lead time and its variability → inventory and storage
Delivery lot size → inventory and storage
Defect and claim history → quality
Pipeline length → obsolescence and quality exposure
Compare the differences, not the totals
You don't need to cost the entire product to choose a vendor. In our example:
The same whichever vendor wins: the oil, refining and filling labor, and freight to distributors. Leave them out.
Different between vendors: price, plus the five hidden costs. Model only these.
The Nissan study made the same choice, building its model for relative accuracy between sourcing options rather than an exact absolute total. That keeps the model small enough to use on every tender, not just the biggest ones.
Turn the model into a negotiation brief
The model doesn't just reject Vendor B. It shows what Vendor B would need to change to win:
Ship from a warehouse near the plant, on delivered terms. Most of the freight penalty disappears.
Deliver weekly in smaller lots. Safety stock, and the overflow warehouse, shrink with it.
Agree a buy-back clause for printed stock stranded by artwork changes. Obsolescence becomes Vendor B's risk.
Restore bottle weight and tighten neck tolerance, then prove it in a trial.
If the first three close most of the gap, Vendor B can still win, but only if its bottles prove as reliable as Vendor A's. That is something the brand can test in a controlled trial before committing the full volume.
Make decisions with imperfect numbers
Hidden-cost estimates are uncertain, especially early. The Nissan study points out that in sourcing there is often no “safe” choice, because picking the wrong vendor costs money either way. Three practices help:
Use the model as a filter. Most vendor comparisons aren't close. In the study's example, a filter like this cleared about 75% of sourcing decisions quickly, so the team could focus on the 25% that were too close to call.
Set a switching threshold. Require a new vendor's modeled advantage to exceed a margin, for example 3% of total delivered cost, to cover what you haven't modeled. Use a wider margin for distant vendors.
Model early. A model is least accurate at the start of a tender, but that is also when it is most valuable, because nothing is signed yet. A rough estimate before the award is worth more than a precise one after it.
Make the model learn, and align the incentives
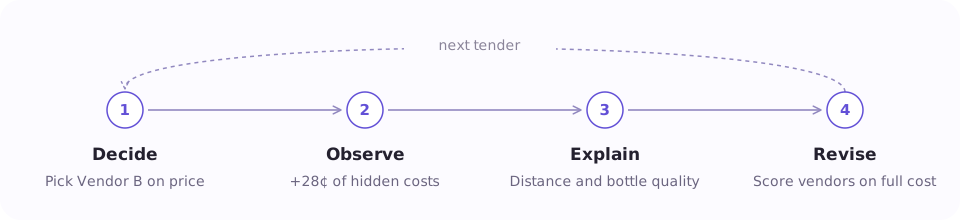
Compare what you expected with what you observed, explain the gap, and update the assumptions before the next tender.
Check the model against reality. Three and six months after a switch, compare the model's expectations with actual freight bills, warehouse invoices, reject data and claims.
Explain every gap. Prices move, processes change, and some assumptions turn out to be wrong. Each cause calls for a different fix.
Keep it traceable. Every figure should lead back to an invoice, a production log, a claims register or a clearly labeled estimate.
Fix the incentives. The Nissan study describes buyers who are asked to make forward-looking decisions that account for hidden costs, but are evaluated on backward-looking measures that ignore them. If procurement is rewarded only for price savings, a better model will change very little. Measure savings on total delivered cost.
Where to start
Pick the next competitive tender in one category and work through it:
List the vendor attributes that drive cost: distance, delivery terms, lead time and its variability, lot size, defect history, and pipeline length.
Map each attribute to a hidden cost, and note which team pays for it.
Model only the differences between vendors.
Attach evidence: freight rates, warehouse costs, and reject and claims history. Label anything that is an estimate.
Decide with a threshold, then check the actual costs three and six months after the award.
The buyer who chose Vendor B wasn't careless. They compared the only number the quote sheet showed. Total cost modeling adds the rows that were missing, so the next vendor is chosen on what it costs to deliver a saleable product, not just on what it costs to buy one.
Frequently asked questions
How Cubesite helps
See the total delivered cost of every vendor before you sign
None of the costs in this story are missing. They sit in different systems that don't talk to each other. Cubesite builds a context and data layer around your supply chain by connecting the systems you already use. There's nothing to replace.
Connects your existing data: purchase orders and vendor quotes from your ERP, freight invoices, warehouse and inventory records, and quality and claims data.
Links every cost to the decision behind it: freight, stock, storage, rejects and write-offs are traced back to the vendor and contract that caused them.
Compares vendors on total delivered cost: every option in a tender shows its full cost, not just its quoted price.
Tracks expected against actual after the award: so your cost model gets sharper with every tender, and savings are measured on what the business really pays.
If this is a priority for your team, use Book a demo at the top of this page to see it on your own data.
 Cubesite